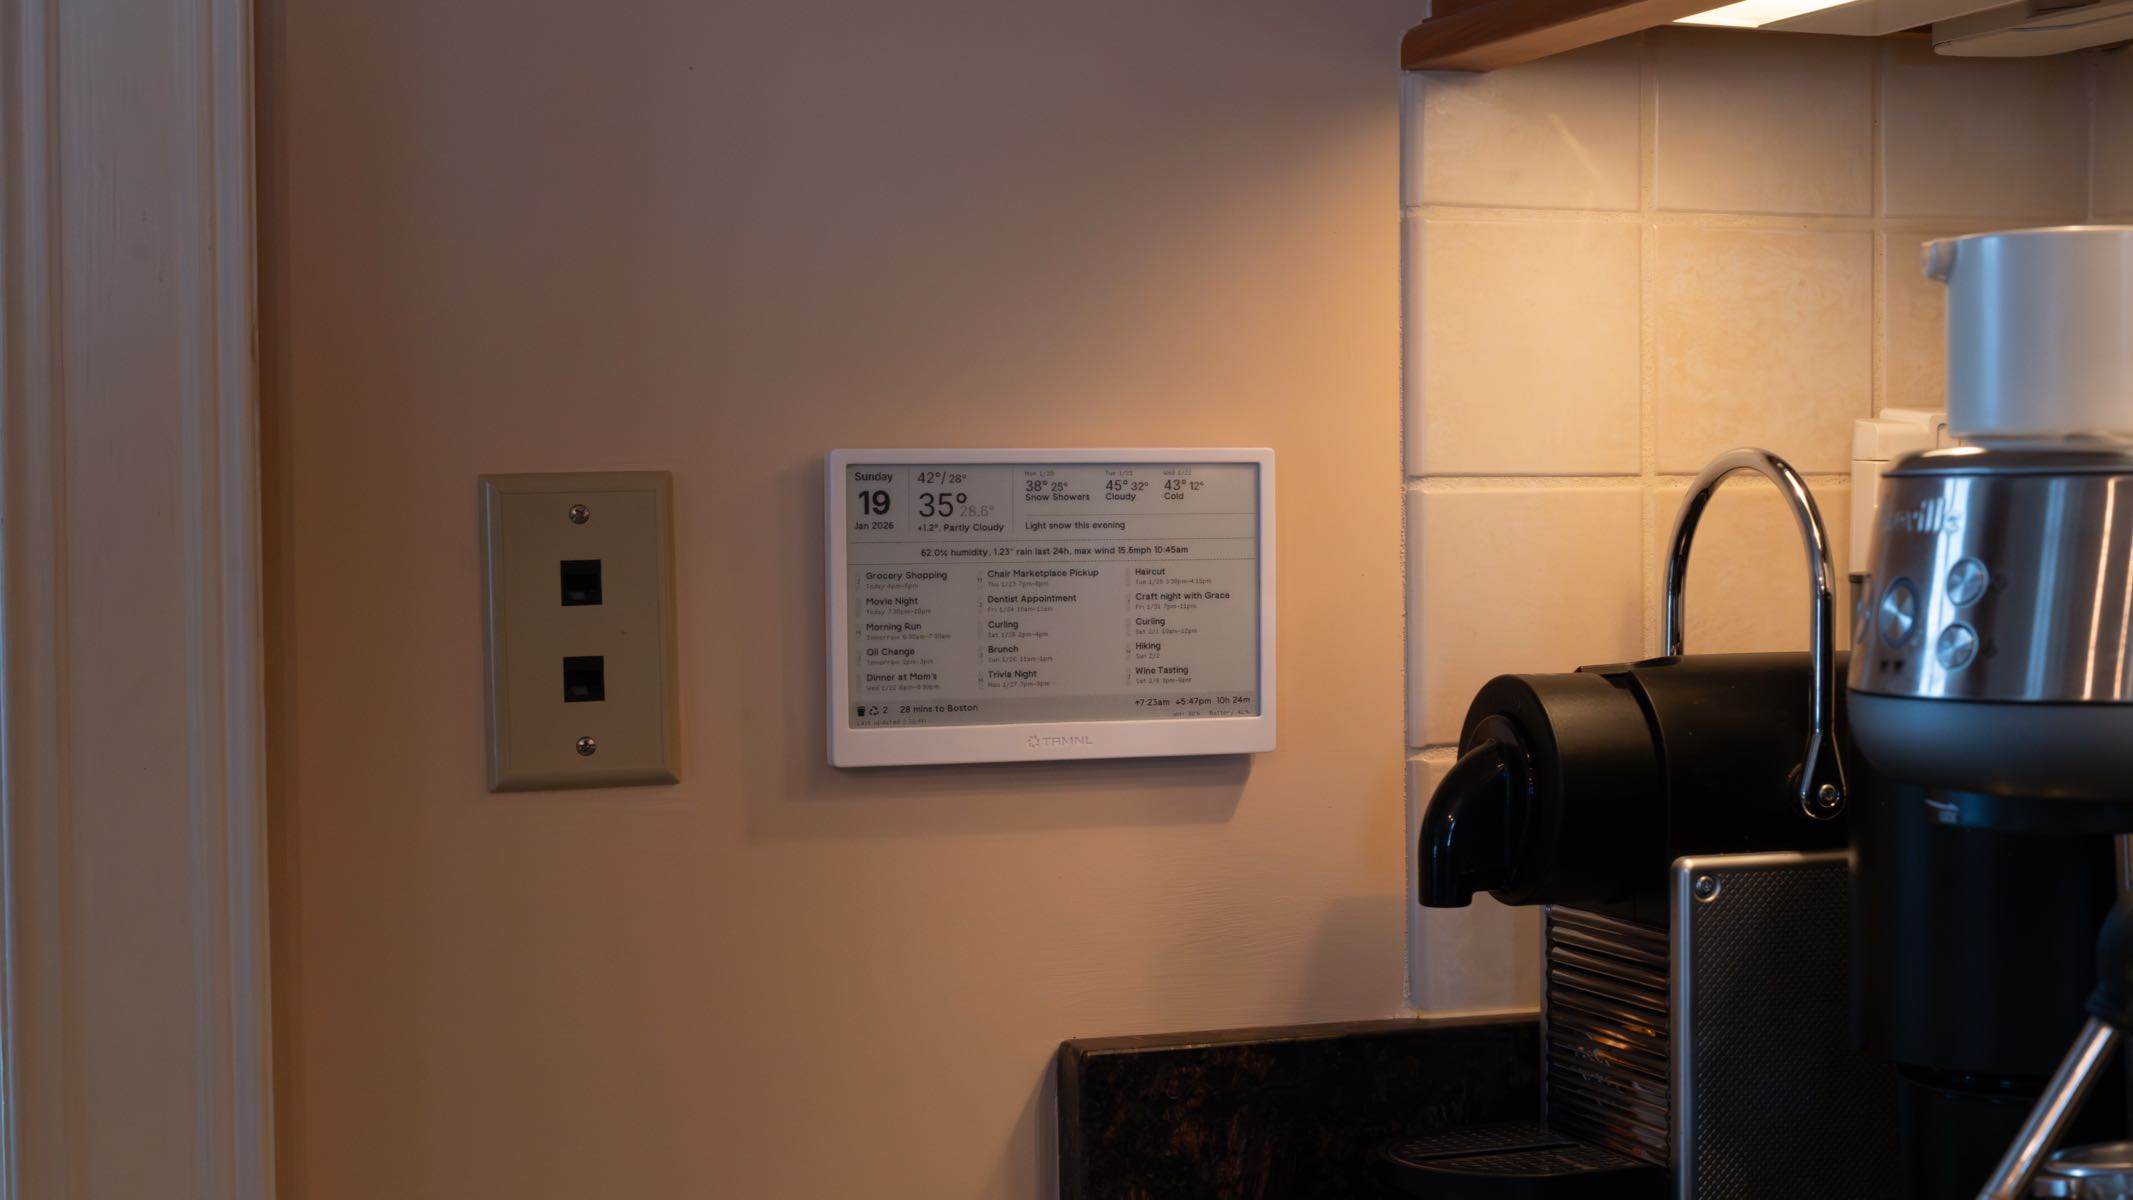
One small project I’ve been working on recently has been an e-ink dashboard which displays marginally useful information on the wall of our house.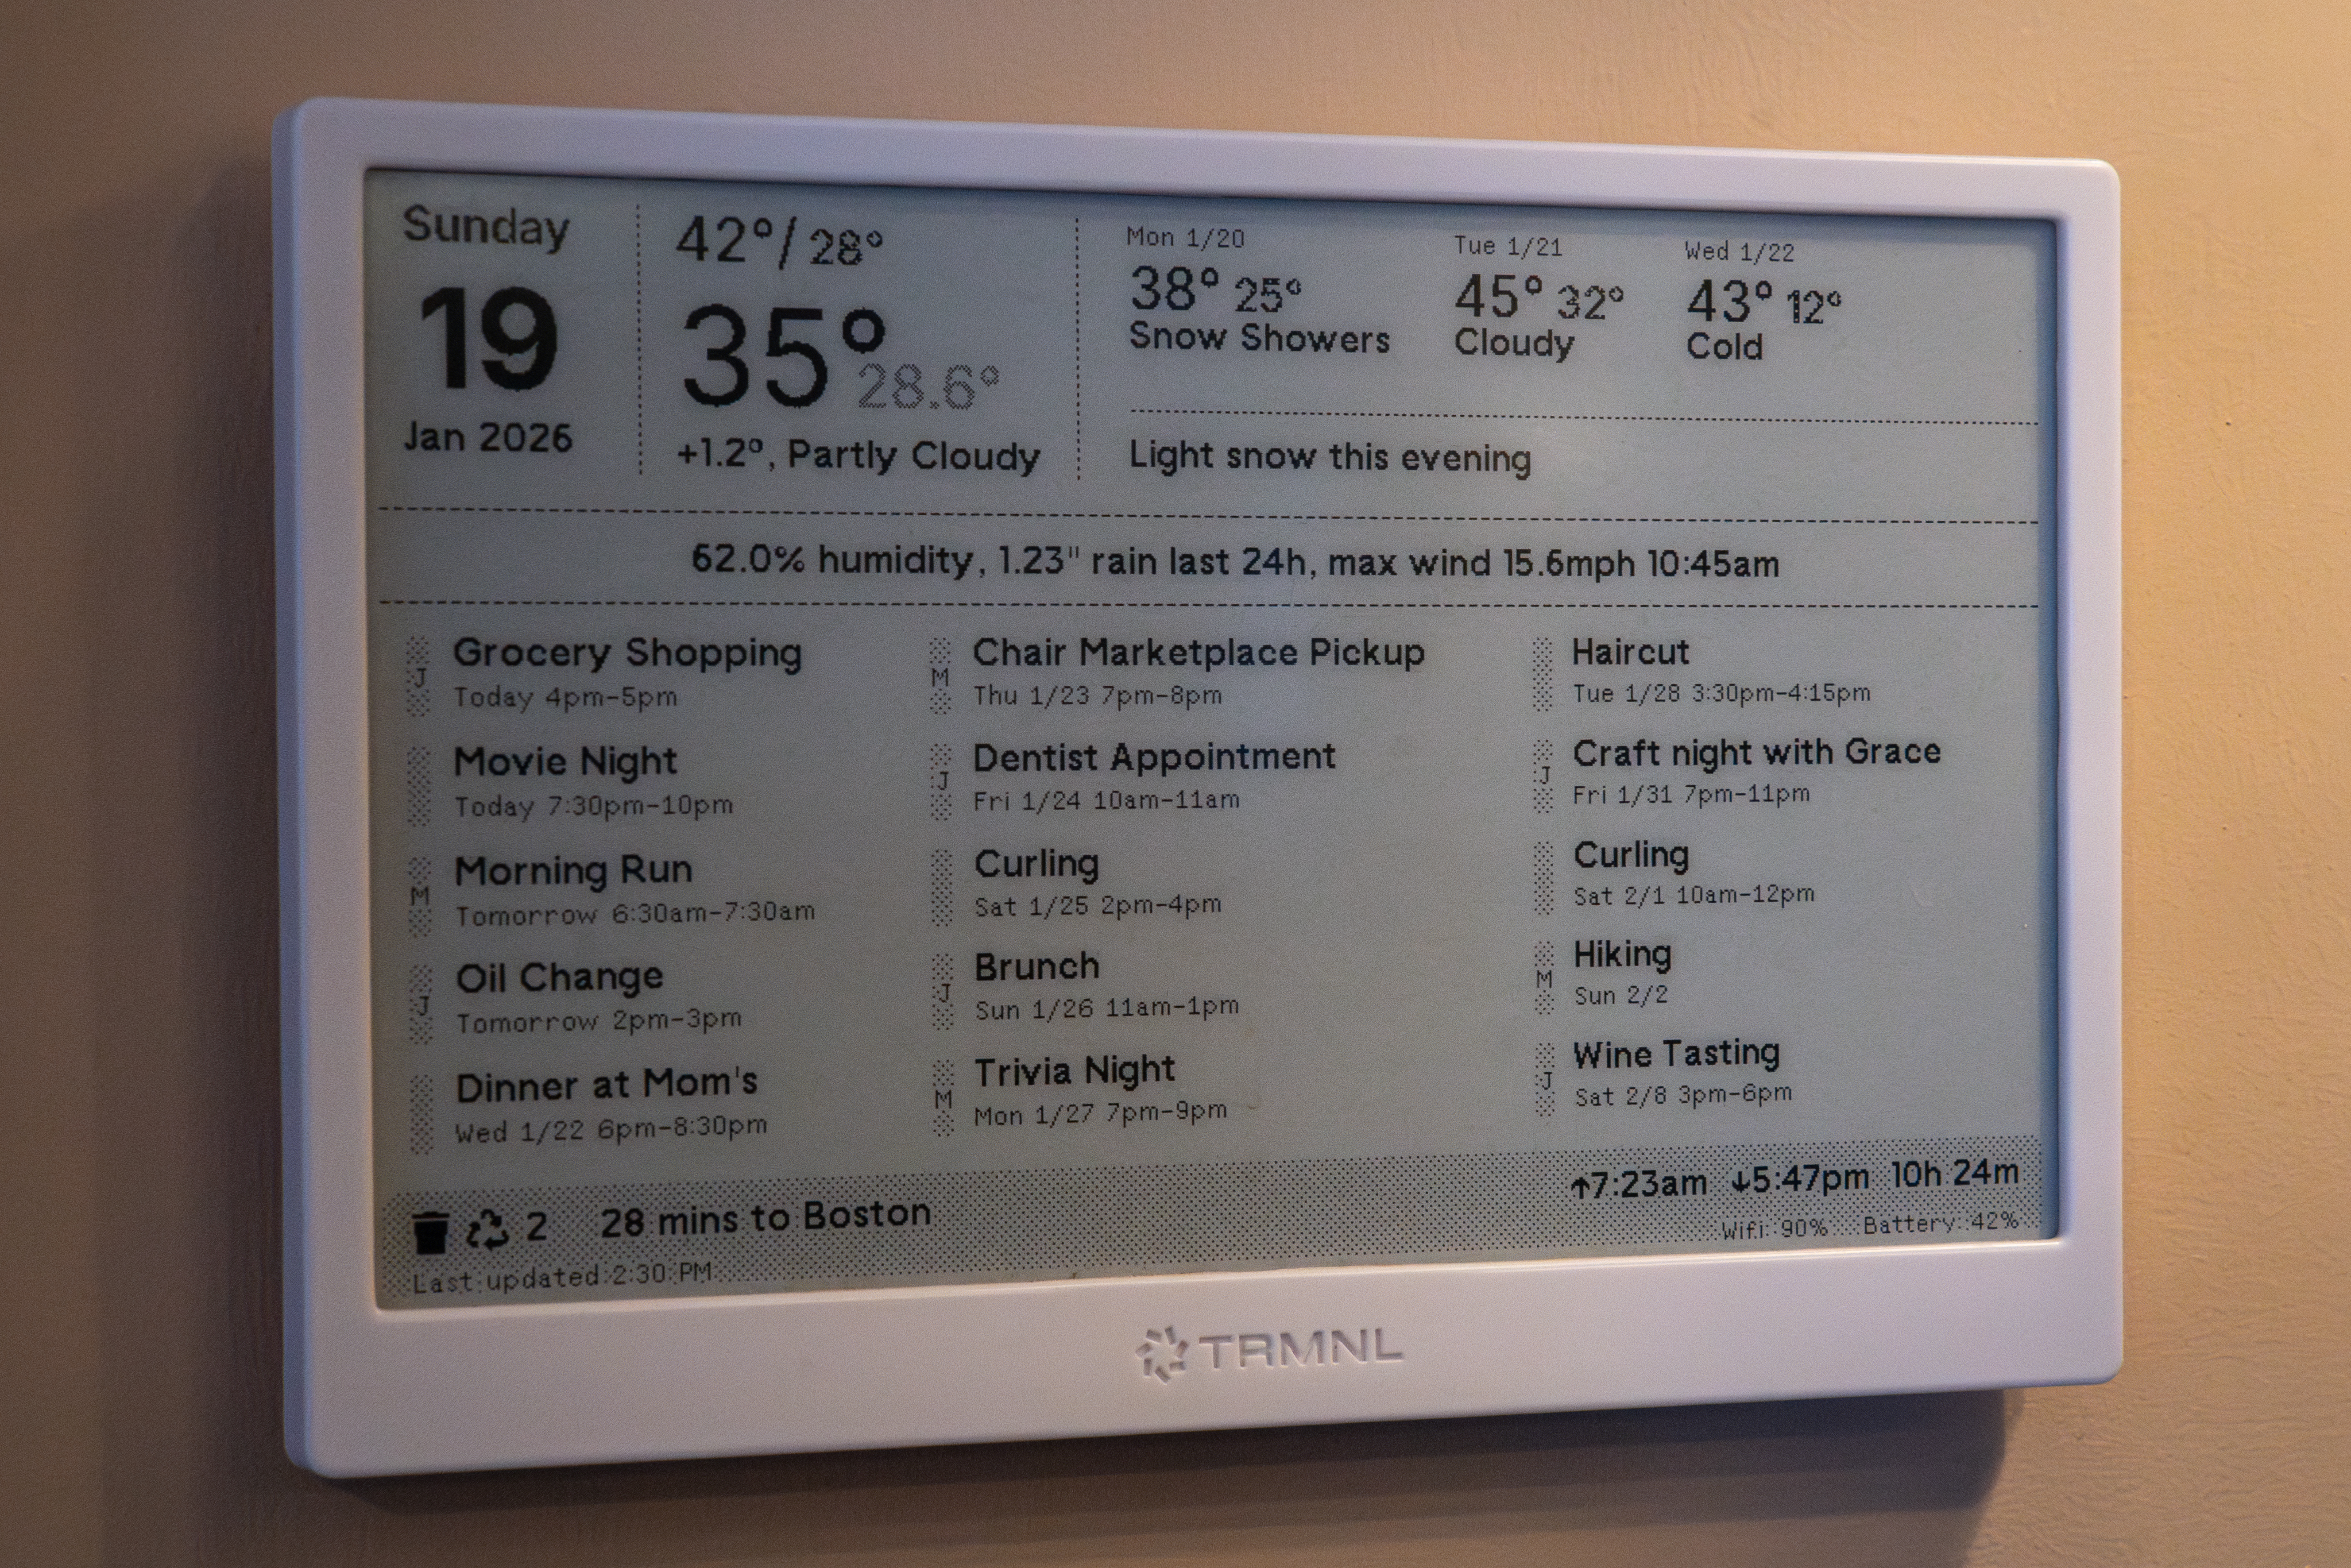 It's fake data so you don't dox me.
Careful readers will notice that this is a TRMNL device. This device is purpose-built for use as a web-connected dashboard. TRMNL (the company) provides a web application where you can configure what your TRMNL (device) displays. The web application lets you put together a “playlist” which shows a rotating series of “plugins:” individual screens that show data in a templated UI.
Through a well-executed advertising campaign, I was aware when I bought my TRMNL that you could not only use the pre-existing, first-party plugins, but that you could also build your own plugins and display whatever you wanted on your device. This is how I configured my device and how I’ve used it ever since setting it up.
The TRMNL is a wireless device that uses an ESP32 to connect to my home network, request a new image from the TRMNL API, and send it to the e-ink display; there is no computation or rendering that happens on the device. Because it only updates the display when it gets a new image from the service’s API, the TRMNL is incapable of real-time data display; in fact, the firmware limits the device to a refresh rate to an interval configurable anywhere between 5 minutes (advertising 40 days of battery life) and 60 minutes (advertising 466 days of battery life). This restriction has influenced the design of the dashboard. No data that changes more frequently than every 10 minutes can be displayed on the TRMNL, because by the time it’s visible on the display, the information will have changed. This dashboard makes for a very bad clock and a very bad “now playing” interface for our hi-fi.
Every ten minutes, our TRMNL wakes up, fetches a new image, displays it, and falls back to sleep. At no point in the process does it fetch new data, nor does it trigger some backend job that fetches any new data to generate a new screen. Instead, my custom plugin refreshes on its own independent timer, periodically running a job on the TRMNL (company)'s servers that fetches data from an API endpoint I control, passes that data into a Liquid template, renders the HTML in (what I assume is) Puppeteer, and saves a screen capture of that rendered web page in an S3 bucket. The web application includes a font and a utility-class stylesheet that seems to optimize for the TRMNL (device)'s one-bit display: images and grays are dithered, the default font looks nice on an aliased display, and I can put together a responsive layout using HTML classes that feel a bit like Tailwind.
I built an API to power this; I run the API on a server in my basement and expose it to the internet through a Cloudflare Tunnel. This API connects to several different services. Besides the time and date, which the server knows inherently, it connects to:
- WeatherKit, to provide weather forecasts, which are then analyzed and turned into text using my own logic. WeatherKit isn’t the most accurate data source out there, but my wife is a die-hard Weather App fanatic and I want to make sure the data she sees in the weather app match up with the data on the dashboard.
- My Home Assistant instance, also running on a server in my basement. I have an Ecowitt WS90 mounted outside which sends data to Home Assistant so I can see current conditions at my house.
- I also store measurements in a database every 10 minutes so I can query the database and see, for example, the highest wind speed in the last 24 hours. I put a few fun stats on the home dashboard but I have a webpage on my LAN where I can really go deep on the data.
- Google Maps. I’m around 40 minutes away from the city center, but that can vary wildly with traffic. I periodically check the driving directions from my house to downtown Boston and show how long it would take to get there.
- My shared calendar with my wife, which we publish to an obscure URL through Apple Calendar. I run some of my own logic on the CalDAV data to turn it into the list of events.
- The app my town uses to notify people about trash day. I spent some quality time with the web inspector to reverse-engineer their API, then I call that same API and fetch the next collection event along with the types of trash they’ll collect on that day. I show a special icon on the dashboard when they’re doing Christmas tree collection.
All this data is fetched in parallel and cached heavily; the latency of this API is surpringly fast. I’ve mounted the device near my coffee maker, which is a high traffic area in our house. It’s been a very fun hobby project and it’s been useful to have so much data visible in a relatively stylish way.